# Process debugging
Tools provided by EximeeBPMS Cockpit allow debugging of processes, in particular insight into process variables and their current values.
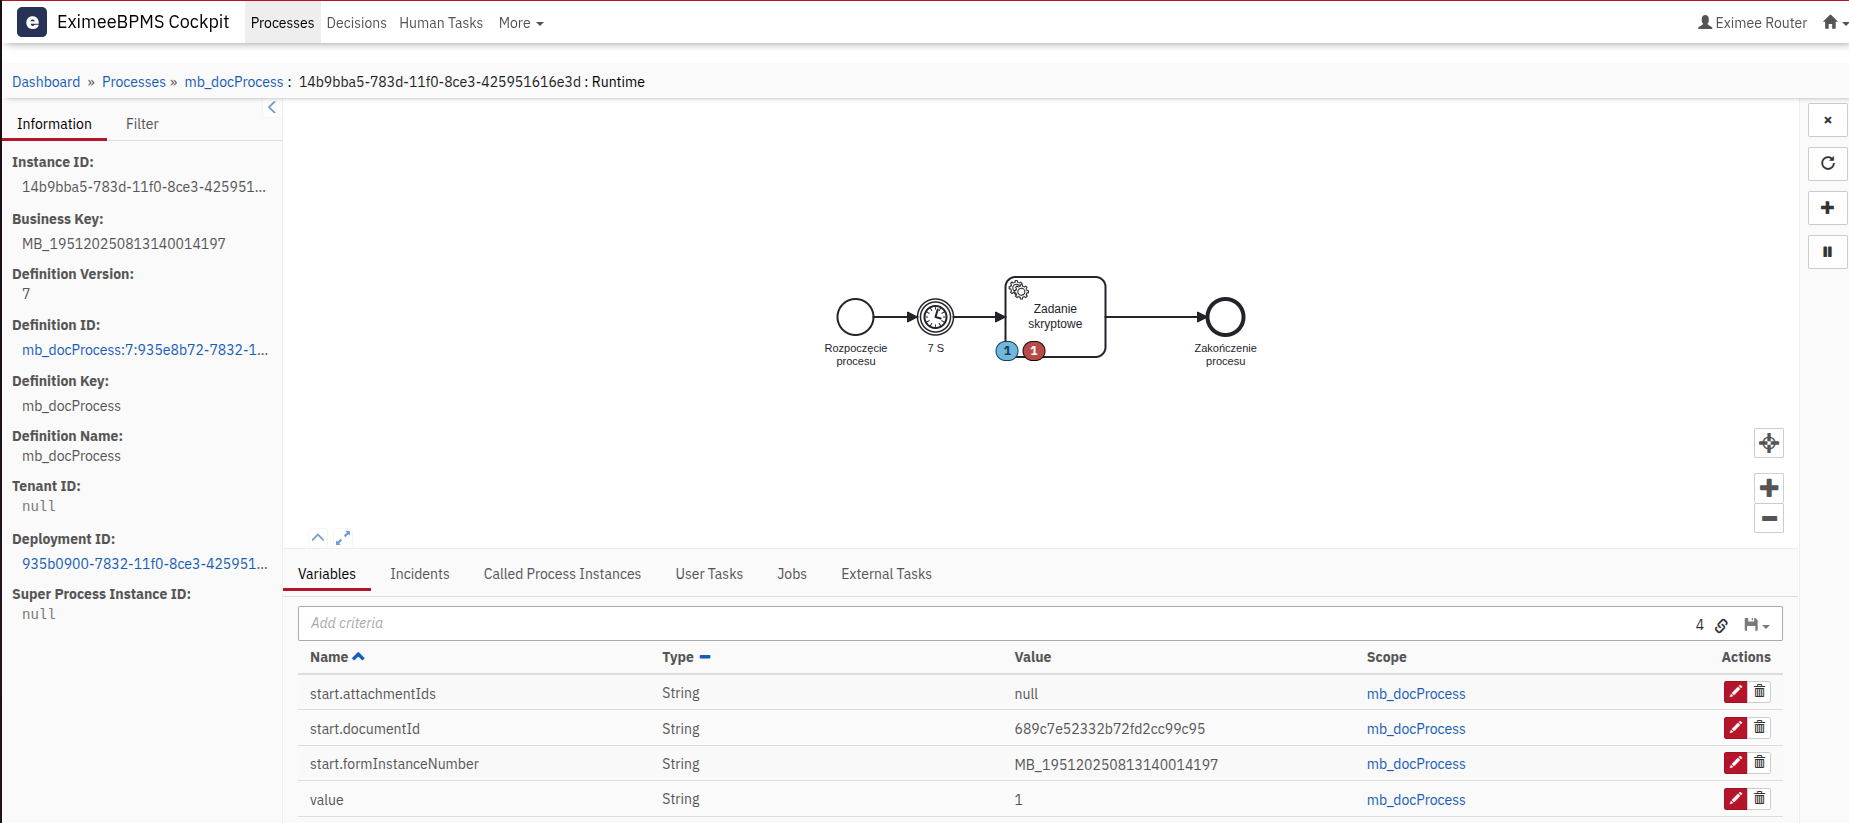
After opening the detailed view of a process, all its running instances are presented. On the diagram, active instances are marked with a blue circle, while locations where an incident occurred are marked in red.
{% hint style="info" %}
Incidents are also visible in the **Process Instances** tab in the **State** column, where a red marker appears next to the instances.
{% endhint %}
After clicking the process number (in the **ID**column), the details of the specific instance are presented.
## Incidents
The **Incidents** displays errors generated by a given process instance. The most important column during debugging is the **Message**column, which shows the message describing the incident. Proper analysis of it is crucial to diagnose the problem.
After clicking the message content, a dialog window with the full message text will be displayed.
On the right side in the **Action** column there is an icon of a curled arrow. Clicking it allows restarting the activity that ended in an incident.
## Variable values
Alternative text for the default value "Choose": **Variables** contain all variables and their values passed to the process. Clicking the red pencil icon allows manual editing of the values. Combined with the action of restarting an activity, this is a useful tool for testing and debugging the process.
## Logs
While working with processes, it may happen that despite the time indicated in **router-api**, the latest version of the process will not appear in EximeeBPMS. In such a case the version visible in Cockpit may differ from the one available in Eximee Designer.
Information about errors that occurred during synchronization can be found in the ***process-handler-executor***.