> For the complete documentation index, see [llms.txt](https://docs.eximee.com/llms.txt). Markdown versions of documentation pages are available by appending `.md` to page URLs; this page is available as [Markdown](https://docs.eximee.com/documentation/documentation-en/budowanie-aplikacji/logika-biznesowa/scriptcode/jak-debugowac-skrypt-krok-po-kroku.md).

# How to debug a script

When a script does not work as expected, quick diagnosis makes it possible to eliminate the problem at the configuration, input data, or logic code level.

## Initial verification on the form

Before you move on to analyzing the code and logs in Kibana, make sure that the conditions for calling the script in the user interface are configured correctly.

1. **Check the script invocation condition**
   * Make sure the execution condition is met and that the component on which the script is defined is correctly listening for events from the component that triggers the change.
2. **Verify the input parameters**
   * Check whether the input parameters have been properly mapped from the form and whether the component receiving the data has active listening enabled.
3. **Verify the output parameters**
   * Make sure that the data returned by the script has been correctly assigned to the appropriate components or their attributes.

## Source code analysis in ScriptCode

When verification on the form does not reveal any errors and the script still returns unexpected results or reports a runtime error, the next step is a thorough review of the logic in the source code.

### What should you pay attention to when reviewing the code?

1. **Data types and formatting**
   * Make sure you are working with the correct data types (e.g. converting strings to numbers before performing calculations, parsing data correctly according to its format, especially taking into account thousands separators and decimal separators in numeric values).
   * To verify complex types, you can use the operator `instanceof`.
2. **Handling missing data (`null` / `undefined`)**
   * Check whether the code is protected against empty input parameters being provided.
3. **Edge cases and business logic**
   * Verify conditional statements (`if/else`) and loops.
   * Check whether the returned object or data structure exactly matches what the component on the form expects.
4. **Inserting temporary diagnostic logs**
   * If the script is extensive, it is worth adding additional logging entries at key points in accordance with [Logging in ScriptCode](/documentation/documentation-en/budowanie-aplikacji/logika-biznesowa/scriptcode/logowanie-w-scriptcode.md).

## Log analysis in Kibana

When the script reports a runtime error, returns an unexpected result, or does not run at all, use Kibana. This tool enables analysis of application and technical logs related to form operation in real time and provides precise information that is not visible from the form itself.

### View configuration and log filtering

To quickly find the relevant events, configure the basic search options and filters.

<figure><img src="/files/bdbb771daa91111cb86f1494cb40956b8b9e596d" alt=""><figcaption><p><em><strong>Figure 1.</strong> Main view of the Discover module in the Kibana application</em></p></figcaption></figure>

### Search options

* **Data view:**
  * **Application logs** (e.g. `eximee-<environment>-<bankName>`) – the main view containing standard system events and script messages.
  * **Sensitive data logs** (e.g. `kafka_eximee_sensitive`) – a dedicated index intended for tracking events containing sensitive data.
* **Environmental filters:**
  * `log.environment` – allows you to narrow the logs to a specific environment (e.g. `DEV`, `TEST`, `STAGE`, `PROD`).
  * `kubernetes.type` – enables selection of the container or service type (e.g. division into sensitive and non-sensitive traffic).
* **Time range (Date Select):**
  * **Relative** - Time counted backwards from the moment of analysis (e.g. *Last 30 minutes* – ideal when testing live).
  * **Absolute** - A fixed time range from–to (e.g. from *04.12.2025 12:00* to *05.12.2025 07:30*).
  * **Chart (Histogram)** - You can also mark the time range directly on the log count chart by dragging the selection with the mouse over the results list.

### Log reading options

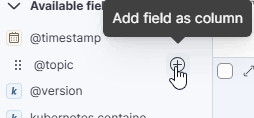
On the left side there is a panel with a list of available filters. By selecting the (+) icon next to the name of a specific filter, you add it to the main view as a readable table.

<figure><img src="/files/6e69689169b1ebfa5e4e778de1e6bf71e5809d41" alt=""><figcaption><p><em><strong>Figure 2.</strong> Event filtering and field selection panel in Kibana</em></p></figcaption></figure>

Suggested options useful for reading logs:

<table data-header-hidden><thead><tr><th width="186.873291015625"></th><th></th></tr></thead><tbody><tr><td>Field name</td><td>What does it show in the log?</td></tr><tr><td><code>timestamp</code></td><td>The time when the entry was recorded in the logs, accurate to the millisecond.</td></tr><tr><td><code>log.eximee.sessionToken</code></td><td>A unique session token for the request/user in the Eximee system. It makes it possible to isolate all traffic generated by a single request.</td></tr><tr><td><code>log.level</code></td><td>Log level (<code>INFO</code>, <code>DEBUG</code>, <code>WARN</code>, <code>ERROR</code>, <code>TRACE</code>). It allows you to quickly filter out errors.</td></tr><tr><td><code>log.message</code></td><td>The actual content of the message or output from the script. It allows you to preview the exact execution state of the code and the data being processed.</td></tr><tr><td><code>log.stack_trace</code></td><td>The full error trace (system exception). It indicates the exact line of code and the class in which the failure occurred.</td></tr><tr><td><code>log.data</code></td><td>Detailed context of script execution. It contains the provided input parameters (inputs), returned output values (outputs), context variables, and diagnostic messages generated directly during the script engine's operation.</td></tr></tbody></table>

{% hint style="info" %}
The availability of individual fields and where the data is stored may vary depending on the type of log and the deployment configuration.
{% endhint %}

### Navigating Kibana

The fastest ways to locate the events you are looking for are filtering by:

* Request context data: request number, client identifier (CIF, NIK).
* Script/service name: the name of a specific validator or service.
* Time range: the exact time window of the user's action.
* Container split: identification of a specific application container.

{% hint style="info" %}
Client identifiers (such as CIF or NIK) are sensitive data. Depending on the security policy and the log masking configuration in a given environment, filtering directly by CIF may be unavailable or restricted. In such cases, it is recommended to search by the process identifier (e.g. the request number).
{% endhint %}

### Useful KQL queries

You can also use KQL (Kibana Query Language) to search logs and combine conditions with the operators `AND` or `OR`.

<figure><img src="/files/2d1c8bb9f40ff92c8ff6b2c388ba0100055d9988" alt=""><figcaption><p><em><strong>Figure 3.</strong> Search bar with a query in KQL (Kibana Query Language)</em></p></figcaption></figure>

<table data-header-hidden><thead><tr><th width="186.873291015625"></th><th></th></tr></thead><tbody><tr><td>Search goal</td><td>KQL query</td></tr><tr><td>Errors of a specific script</td><td><code>log.data: "scriptName" AND log.level: "ERROR"</code></td></tr><tr><td>Logs for a specific request</td><td><code>log.message: "RequestId"</code></td></tr><tr><td>Excluding informational logs</td><td><code>NOT log.level: "INFO"</code></td></tr><tr><td>Combining multiple log levels</td><td><code>log.level: ("ERROR" OR "WARN")</code></td></tr></tbody></table>

{% hint style="info" %}
The availability of individual fields and where the data is stored may vary depending on the type of log and the deployment configuration.
{% endhint %}

## Examples of log analysis in Kibana

**Script invocation (ScriptCode)**

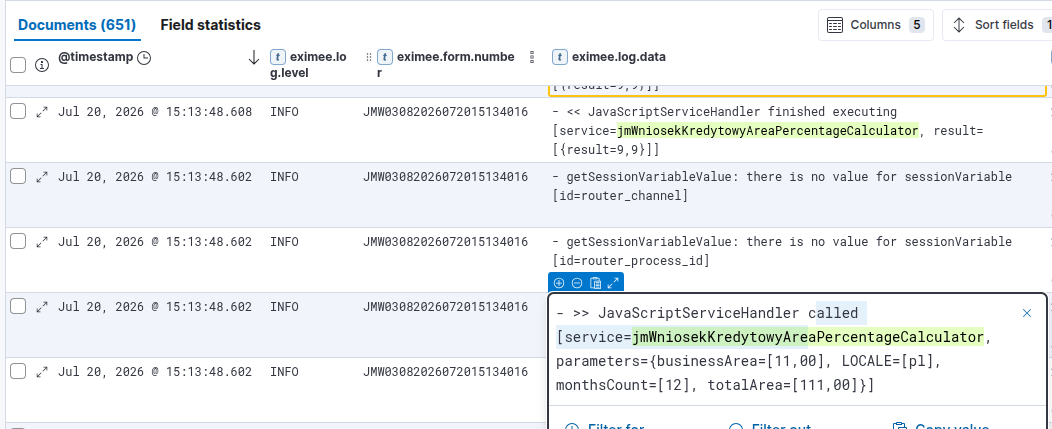
We search for logs in Kibana by the script name (using the filter `log.data`). This allows us to trace the entire execution cycle: check the input data, output result, correctness of the business logic, and calculated values.

* Script input (parameters passed from the form):

  ```
  - >> JavaScriptServiceHandler called [service=jmWniosekKredytowyAreaPercentageCalculator, parameters={businessArea=[11,00], LOCALE=[pl], monthsCount=[12], totalArea=[111,00]}]
  ```
* Script output (returned result):

  ```
  - << JavaScriptServiceHandler finished execution [service=jmWniosekKredytowyAreaPercentageCalculator, result=[{result=9,9}]]
  ```

<figure><img src="/files/fdc0a5dcb4a716a1433f49816bdf2910be197544" alt=""><figcaption><p><em><strong>Figure 4.</strong> Logging the script invocation together with the input parameters and result</em></p></figcaption></figure>

**Validator invocation**

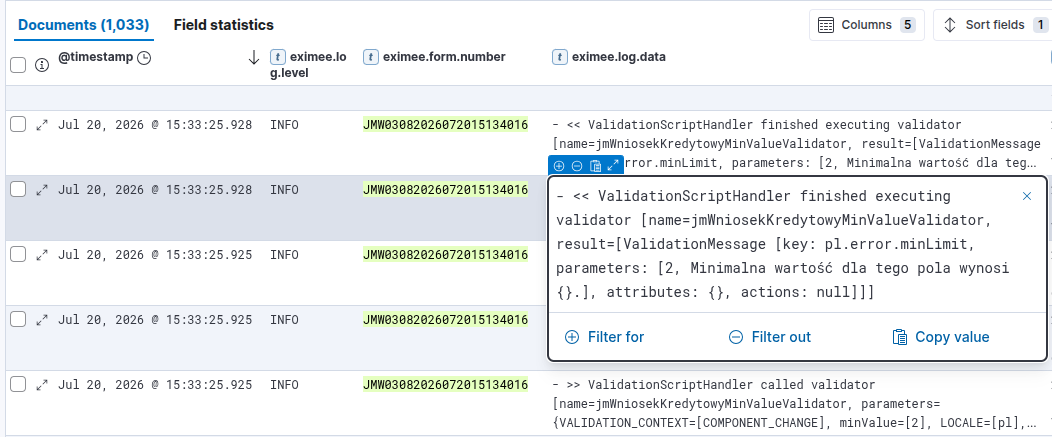
As with scripts, validator logs are filtered by their name. This allows you to view the passed input data, the invocation context, and any error messages.

* Start of validation:

  ```
  - >> ValidationScriptHandler called validator [name=jmWniosekKredytowyMinValueValidator, parameters={VALIDATION_CONTEXT=[PAGE_CHANGE_FORWARD], minValue=[2], LOCALE=[pl], userInput=[1]}]
  ```
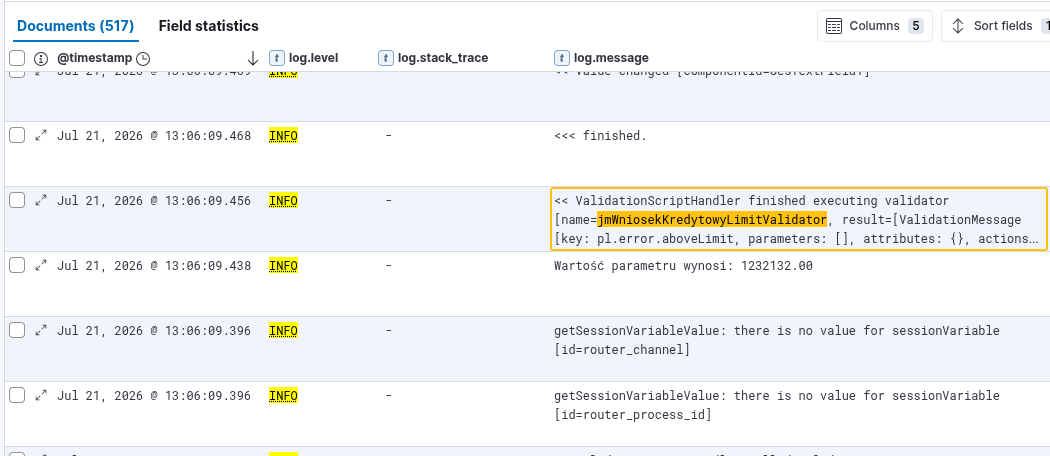
* End of validation (returned negative validation):

  ```
  - << ValidationScriptHandler finished executing validator [name=jmWniosekKredytowyMinValueValidator, result=[ValidationMessage [key: pl.error.minLimit, parameters: [2, Minimal value for this field is {}.], attributes: {}, actions: null]]]
  ```

<figure><img src="/files/1337472d99352043d46c6c63ce61be8e45f0d66b" alt=""><figcaption><p><em><strong>Figure 5.</strong> Validator invocation flow ending with an error message (negative validation)</em></p></figcaption></figure>

**Script execution errors**

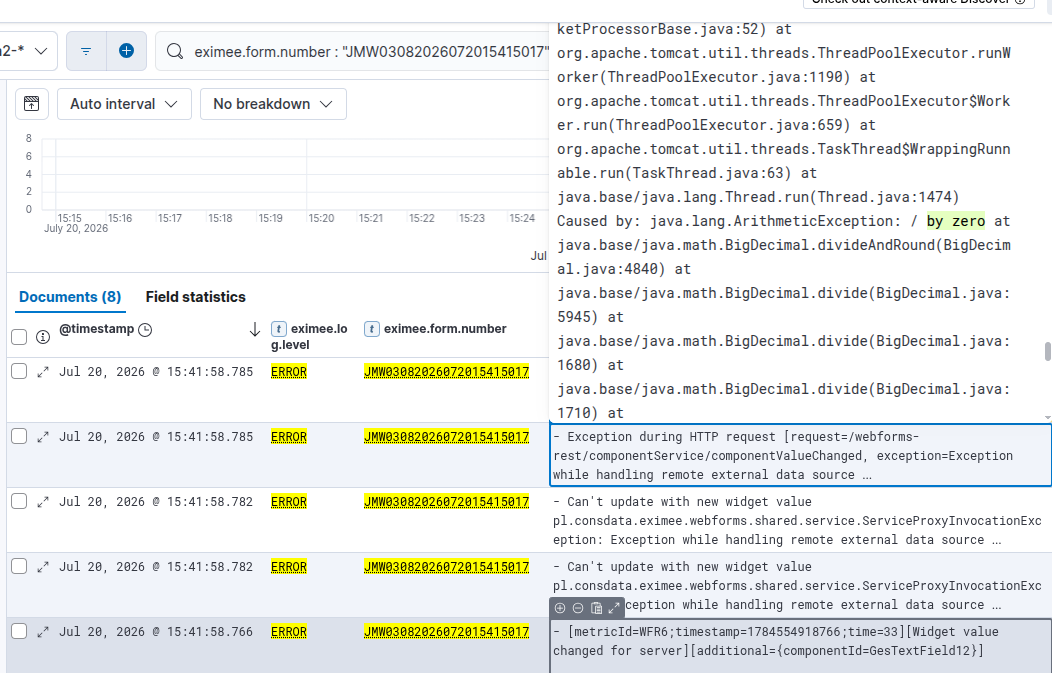
If an unhandled exception occurs during script execution, Kibana records the execution error together with the stack trace. By analyzing the calls of subsequent classes in the stack, we can precisely identify the direct cause of the failure — for example, a mathematical error related to division by zero:

```
Caused by: java.lang.ArithmeticException: / by zero
```

<figure><img src="/files/5d172b2c4d1fdfc02212fe3822ca6c9080d7106e" alt=""><figcaption><p><em><strong>Figure 6.</strong> Logs showing an unhandled exception (stack trace)</em></p></figcaption></figure>

**Using log levels**

The method used for temporary tracking of application state and verification of variable values in ScriptCode scripts is `Logger.info(...)`. It allows diagnostic messages to be written to the system logs.

```
// Example of a temporary diagnostic log in ScriptCode:
Logger.info("Parameter value is: " + paramValue);
```

<figure><img src="/files/7022c85e17525818f5abcb887cb84f9912ce69c7" alt=""><figcaption><p><em><strong>Figure 7.</strong> Logging a diagnostic entry from the script in Kibana</em></p></figcaption></figure>


---

# Agent Instructions
This documentation is published with GitBook. GitBook is the documentation platform designed so that both humans and AI agents can read, navigate, and reason over technical content effectively. Learn more at gitbook.com.

## Querying This Documentation
If you need additional information that is not directly available in this page, you can query the documentation dynamically by asking a question.

Perform an HTTP GET request on the current page URL with the `ask` query parameter, and the optional `goal` query parameter:

```
GET https://docs.eximee.com/documentation/documentation-en/budowanie-aplikacji/logika-biznesowa/scriptcode/jak-debugowac-skrypt-krok-po-kroku.md?ask=<question>&goal=<endgoal>
```

`ask` is the immediate question: it should be specific, self-contained, and written in natural language.
`goal` is optional and describes the broader end goal you are ultimately trying to accomplish on behalf of the user. GitBook uses it to tailor the answer towards what is most useful for that goal.

The response will contain a direct answer to the question and relevant excerpts and sources from the documentation.

Use this mechanism when the answer is not explicitly present in the current page, you need clarification or additional context, or you want to retrieve related documentation sections.